Discussion / Conclusion
Contents
Discussion / Conclusion#
Conclusion#
Explainable AI is a set of tools and frameworks to help you understand and interpret predictions made by your machine learning models. The various machine learning algorithms have different levels of inherent explainability. For example, random forest models, which are based on decision trees, are more easily able to explain why they made the predictions they did. Neural networks, on the other hand, are more of a black box.
Because of this, we may actually favor the random forest model with threshold moving over the neural network model in the binary classification scenario. Even though the random forest model has slightly worse accuracy, the rationale behind its predictions are much more explainable.
Now that we have trained machine learning models, we can predict the building type for our 219,054 unknown buildings in North Carolina. Combining these predictions with socio-economic data and flood forecast models, we are able to make risk assessments that were not possible without the machine learning. For example, we obtained the 100-year flood map from the FEMA National Flood Hazards Layer. The phrase “100-year flood” is used to describe the extent of a flood that statistically has a 1-percent chance of occurring in any given year. Here, it is used for illustrative purposes of an overall disaster response application.
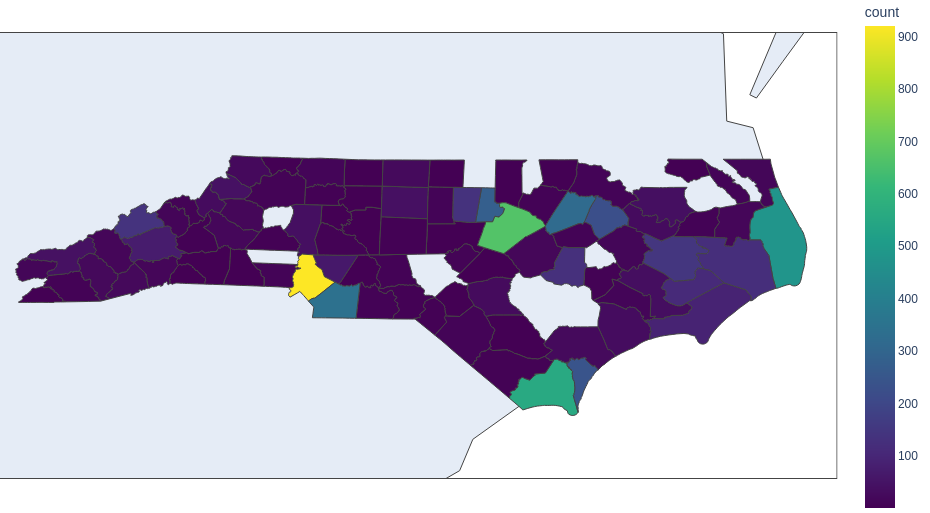
There are 5838 buildings impacted by the 100-year flood. Prior to having machine learning models, we would not know what types of buildings these are. With ML, we can now say, with a high degree of accuracy, there are 5452 Residential buildings, 349 Commercial buildings and 37 Industrial buildings impacted by the 100-year flood in North Carolina.
Moreover, combining these results with U.S. Census data, we find 33% of residential buildings impacted and 63% of commercial buildings impacted are in counties below median income. A 100-year flood will disproportionately impact Mecklenburg, Wake, Dare, and Brunswick counties. Nearly a third of all flooded residential buildings will be in counties where the median income is below the state median. Sixty three percent of commercial buildings predicted to flood during a 100-year flood are in economically disadvantaged counties.
Although buildings are just one small part of the urban multiplex, the application of machine learning can help us better understand this interconnected system leading to enhanced risk assessment and forecasting.

